
Howdy folks!
Another two months, another chuck full of a wide variety of projects. Life’s good when it’s busy.
I
Does Cartographic fashion exist?
Yep! Though, that fashion depends more on the tools than a communities whim to put floral patterns on everything. Still, in a mostly-facetious conversation about Cartographic fashion, I decided that I needed to make a plaid map. …and here’s the product of that.
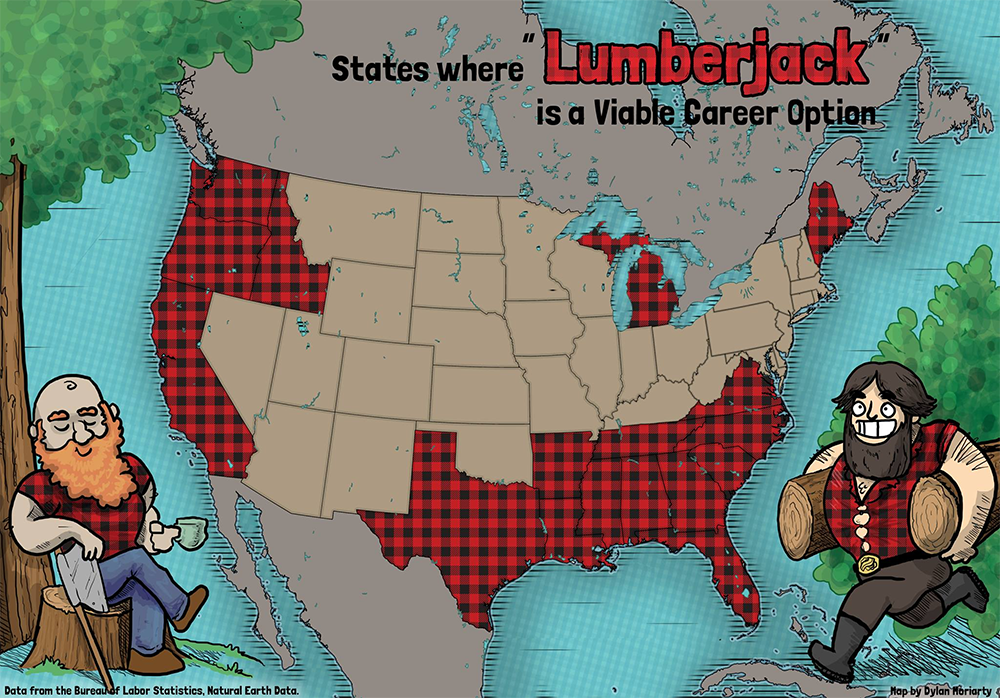
For those interested in the data, the choropleth is based off of which states have > 500 jobs in the logging industry.
II
A major project I’ve been building of late is a framework for agresource. Basically, they’re running all over the Midwest taking pictures of farmers crops, and wanted to have an interactive map which the users can both check out where the farms are and the pictures as the season progresses.
This project was a lot of fun, and a great way to work on some hefty manipulation of Leaflet icons.
III
As a follow-up to the work I’d been doing with AgResource, I was curious seeing how far I could push icons drawn with Leaflet. Essentially, I wanted to test 1. How many icons could be drawn on a screen before the user would start to get a significant amount of lag? and 2. Can those icons just be drawings as opposed to svg circles?
Decided to test both things (and GeoJson manipulation within the script) with this goofy thing- Click a Cat, Get a Cat.
IV
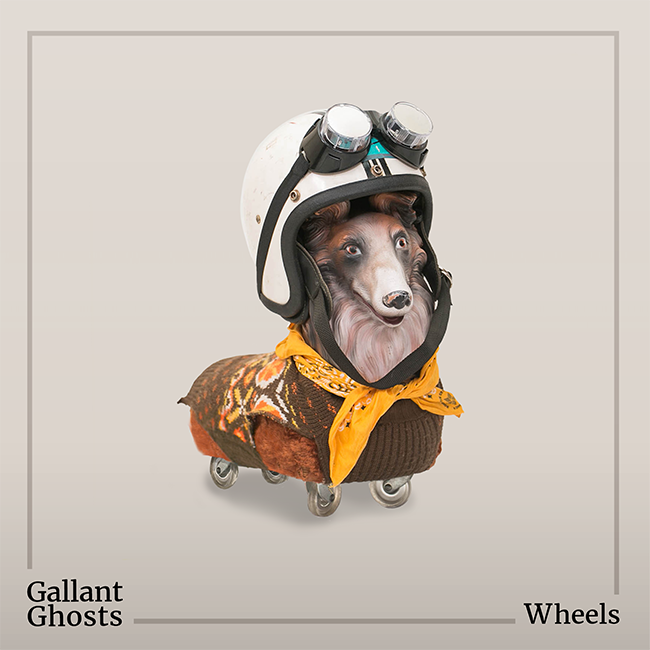
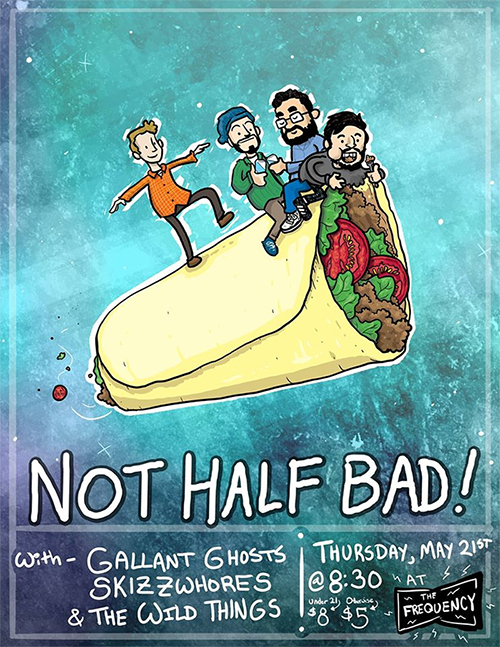
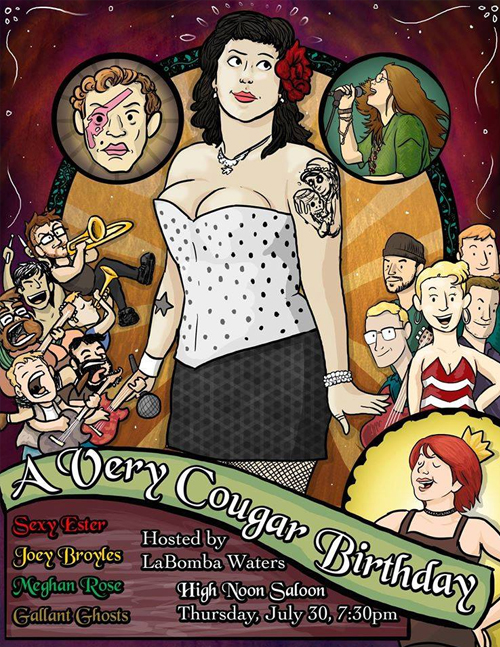
My band Gallant Ghosts finally released our EP! It was a lot of work, but the good kind. Listen and enjoy while also enjoying a couple more posters I’d drawn up for some of our shows.
Cheers!